Interactive Tools
A breach doesn’t become a crisis the moment an attacker gets in — it becomes one the moment they can move. These tools put that moment in your hands: map the threat, size the blast radius, and expose the gaps where lateral movement runs free. See how fast containment changes the outcome.
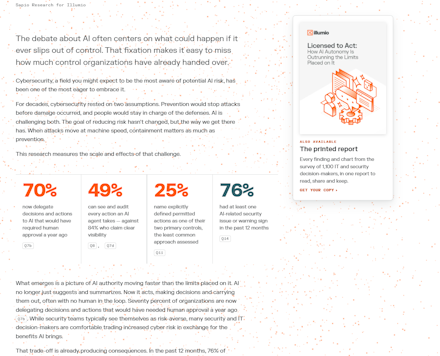
See how far AI autonomy has outrun its limits
Licensed to Act: AI Cyber Risk Report 2026
An interactive tour of a new Illumio survey of 1,100 IT and security leaders in 10 markets. See how much control teams have handed to AI, where its limits fall short, and how the picture changes by market, role, and industry.
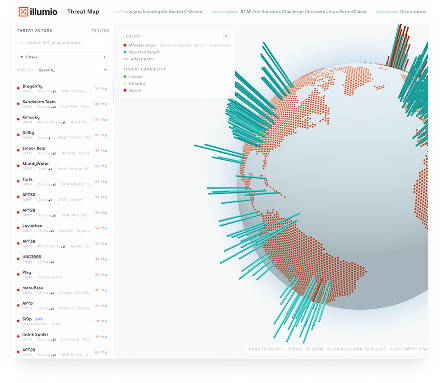
See who's out there — and how they operate
Threat Map
An interactive globe of the world's known threat actors, built on MITRE ATT&CK. Spin it to see where each group operates from, who it targets, the techniques and malware it uses, and how severe the threat is — plus a cyber news ticker that's refreshed every day.
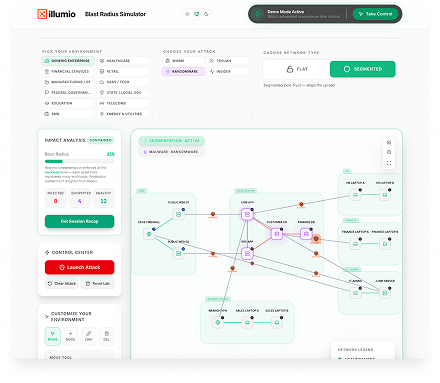
See how far one breach can reach.
Attack Blast Radius Simulator
Model an intrusion and watch the blast radius expand across your estate — then apply segmentation and watch it collapse to where it started.
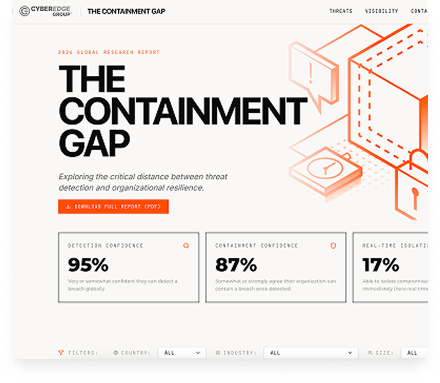
See the gap between spotting a breach and stopping it
Containment Gap
An interactive tour of global research from Illumio and CyberEdge Group: how confidently organizations say they detect attacks versus how fast they can actually contain them — explore the findings by industry, region, and company size.
See breach containment in action
Turn raw data into clear, actionable insight, so you can contain threats before they spread.