Illumio Insights
See every east-west traffic flow across your hybrid environment. Illumio Insights surfaces critical threats, streamlines remediation, and helps you enforce smarter policies to contain breaches fast.


Security starts with seeing the full picture
Now with Network Posture: a real-time score of lateral movement risk. Gauge your compliance readiness and accelerate microsegmentation.
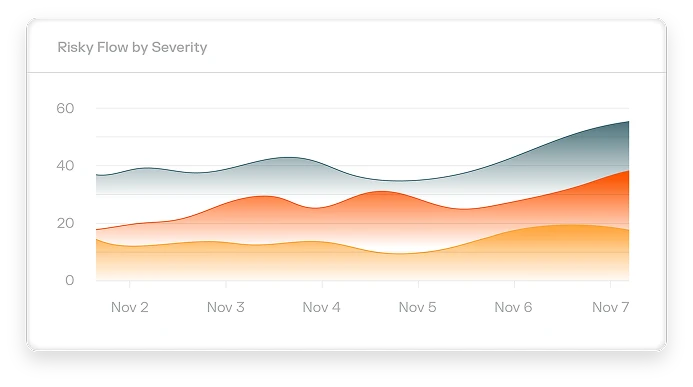
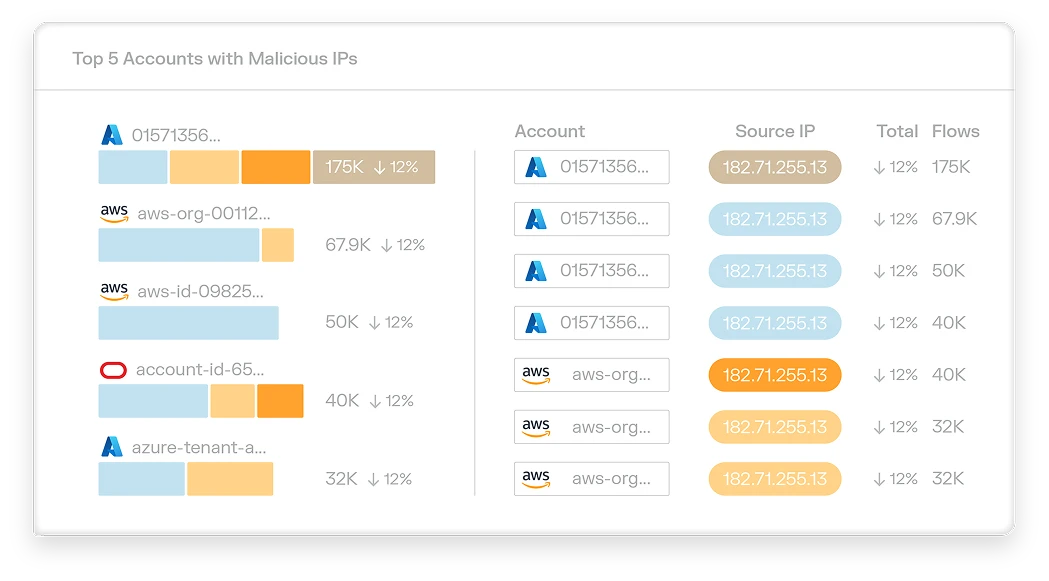
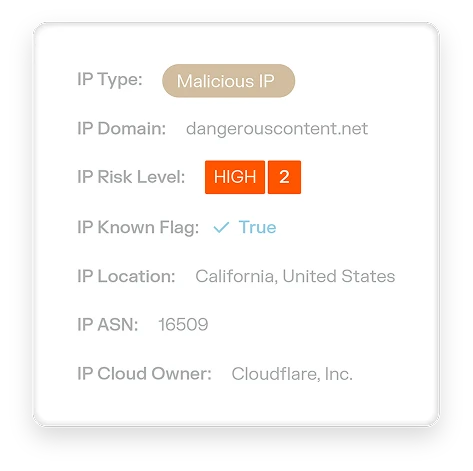
Uniform, context-rich, and scalable AI observability — minus the alert fatigue. Understand attacker behavior. Cut through alert noise. Prioritize breach response.

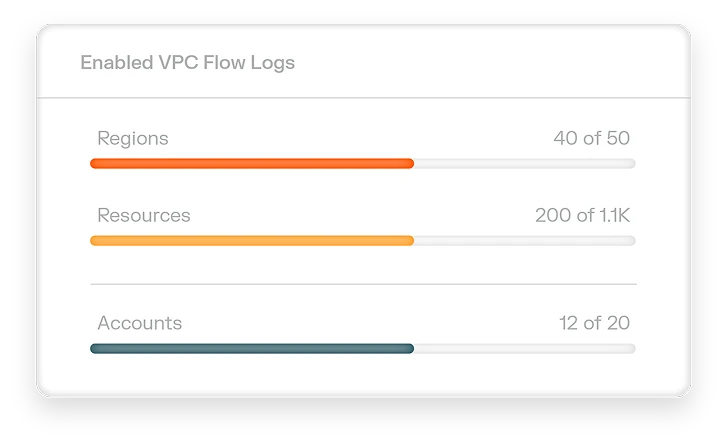
See every workload and traffic flow. Find policy gaps before attackers do. Keep a real-time posture score so you know your risk is shrinking, not growing.
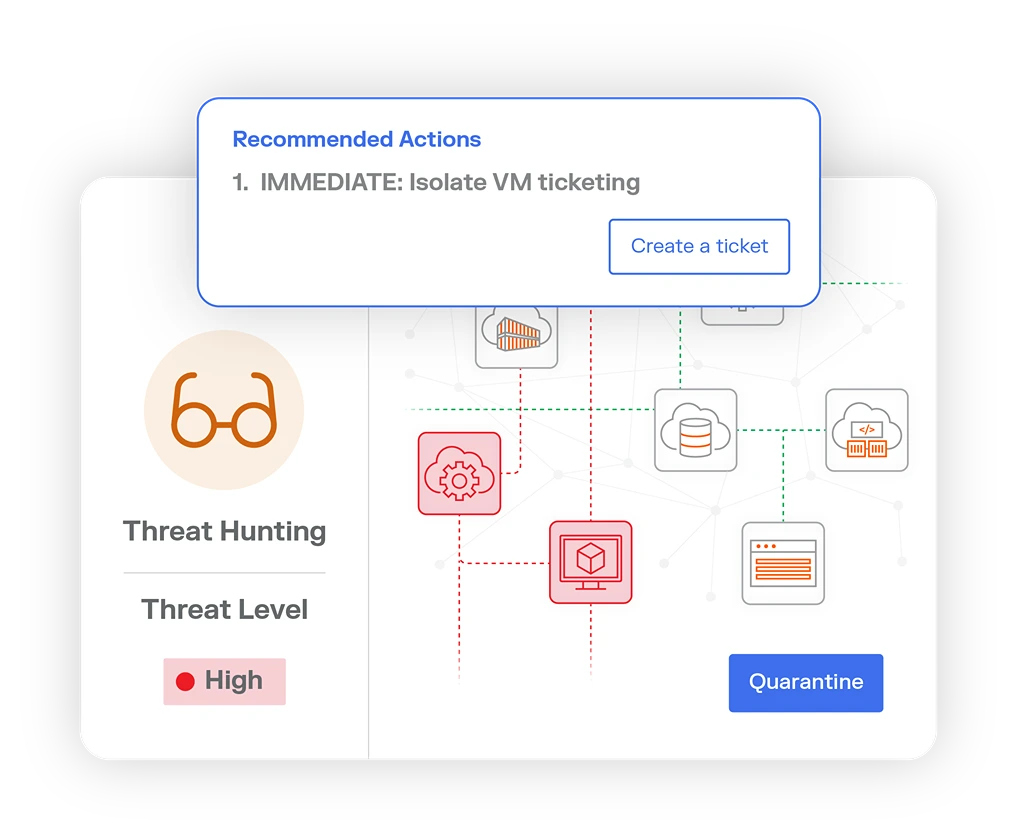
Swiftly block and isolate threats based on real traffic behavior. Get an AI-guided remediation plan with policy recommendations to close exposure gaps and prevent lateral spread.


Score your lateral movement risk in real time
Network Posture gives you a real-time view of lateral movement risk by validating actual network flows — not just static rules. It scores your environment against major compliance mandates, highlights the riskiest issues, and speeds up remediation. You see where policies fall short and where to tighten them, so your microsegmentation strategy keeps getting stronger.
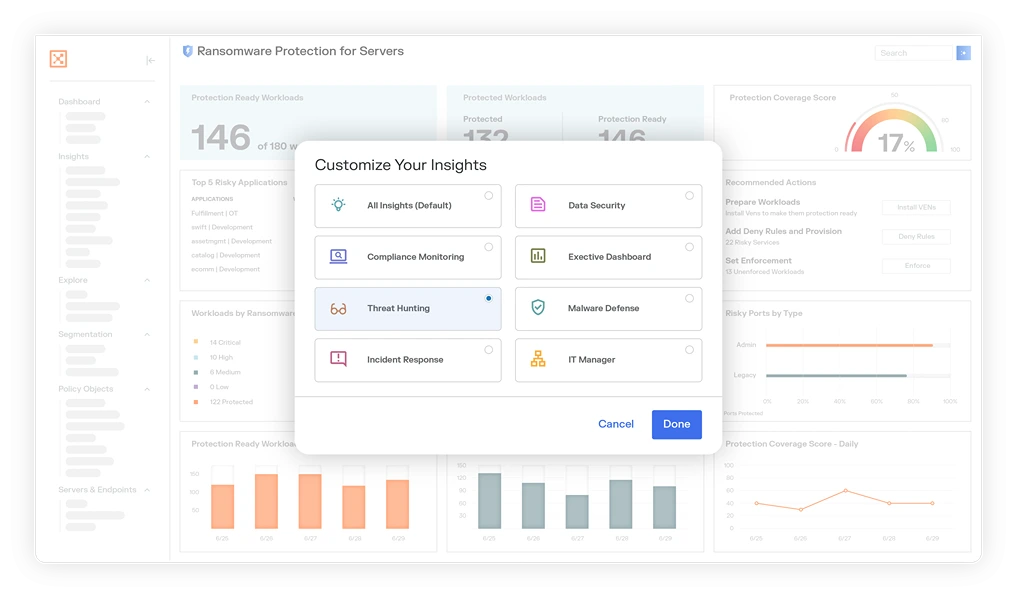
Meet Insights Agent: your AI guide for smarter breach response
With AI-powered guidance aligned to specific roles, Insights Agent surfaces the issues that matter most on each workload. It helps you contain threats faster and move investigations forward with confidence — giving you context, confidence, and clear next steps.
Find Illumio products



AI cloud detection and response (CDR)
Rapid, cloud-scale deployment
Push-button, agentless deployment delivers AI security graph-powered insights across millions of workloads in minutes



Unmatched threat detection with AI-powered observability
Significantly reduces the mean time to detect (MTTD) by uncovering unseen threats and attack paths
One-click attack containment
Immediately neutralizes potential risks and reduces the mean time to respond (MTTR) with one-click containment

Accelerate and optimize microsegmentation
Find critical control gaps. Confirm your fixes worked. Keep improving segmentation as your environment changes.
Security wins powered by Illumio Insights
Illumio Insights gives you the visibility and intelligence you need to connect the dots across your hybrid multi-cloud environment and stop lateral movement.
Uncover unwanted lateral movement. Prioritize high-risk alerts. Lock down connections attackers use to spread.
Spot suspicious behavior the moment a workload is flagged. Trace the activity across your environment. Cut off quarantine compromised workloads before attackers move laterally.
Uncover excessive access and overly permissive policies. Get recommendations to close control gaps and right-size access across your environment.
Track unusual outbound activity and flag the workloads responsible. Spot suspicious data flows early — and cut them off before your data walks out the door.

Illumio Insights will give us real-time visibility and control over our risky ports, significantly reducing our risk exposure and improving compliance with industry standards. This will enable us to quickly identify vulnerabilities and address them before they become threats.
Try Illumio Insights free
Gain workload visibility and traffic intelligence to identify policy gaps and contain threats fast — before attackers move laterally.



Illumio Insights
Learn about hybrid multi-cloud detection and responsesolution built on an AI-powered security graph

The 2025 Global Cloud Detection and Response Report
Discover how 1,150 global cybersecurity leaders are tackling alert fatigue, blind spots, and lateral movement in the hybrid multi-cloud.

Illumio Insights Explainer Video
DiscoverAI-powered hybrid cloud detection and response (CDR) that identifies lateral movementrisks, detects attacks, and contains instantly across your hybrid multi-cloud –with Discover how Insights identifies lateral